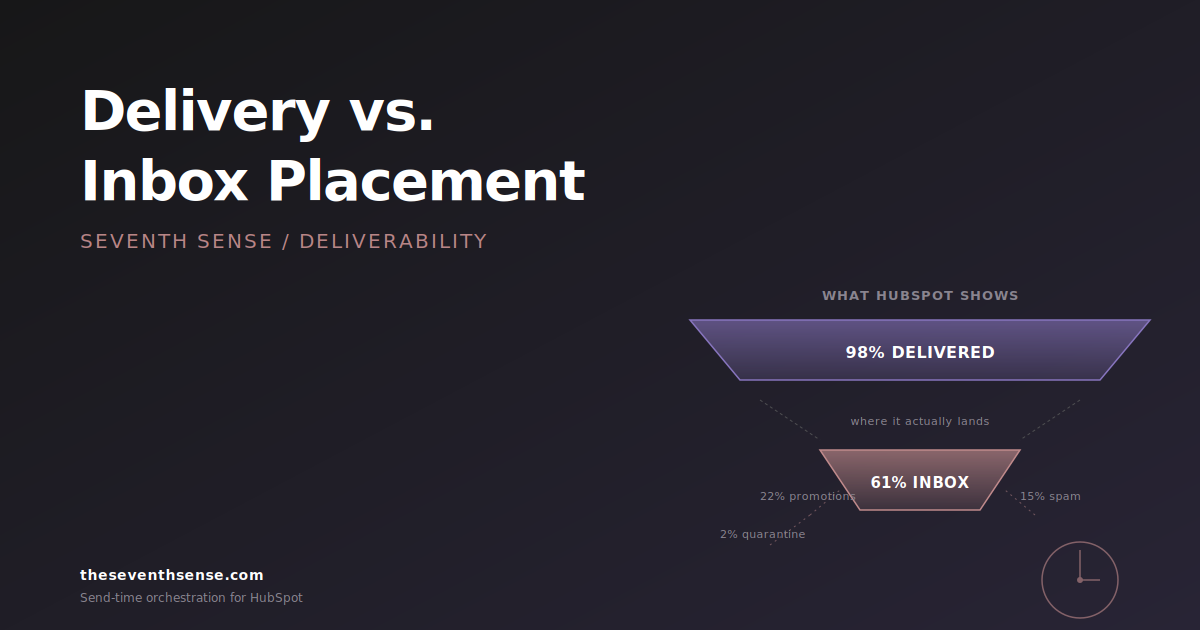
A VP of marketing at an enterprise software company once forwarded me her HubSpot email report and asked why her open rates were tanking. The report showed a 99.2% delivery rate on her last campaign. Beautiful number. Looked great in the board deck. The problem: email inbox placement for that same campaign was 61%. Roughly four out of every ten emails she'd "delivered" had gone straight to spam, and HubSpot had counted every single one of them as a successful send.
This is the most consequential misunderstanding in HubSpot email reporting. Delivery and placement are two different things, and HubSpot only measures one of them. In my experience, most marketers don't know the distinction exists until something catastrophic happens to their engagement numbers.
What "delivered" actually means in HubSpot
When HubSpot tells you an email was delivered, it means exactly one thing: the receiving mail server accepted the message. The TCP handshake completed, the SMTP exchange went through, and the server didn't issue a hard bounce.
That's the entire bar. The mail server could have accepted the message and then immediately routed it to the spam folder. It could have quarantined it for an admin review that no one will ever do. It could have silently dropped it into a hidden filter. HubSpot's delivery metric counts all of these as successful deliveries because, from HubSpot's perspective, they are. The message was accepted.
This is true of every ESP, by the way — not just HubSpot. But HubSpot's reporting interface makes "delivery rate" so prominent that marketers internalize it as a quality signal, and it isn't one. It's a transit signal.
What email inbox placement actually means
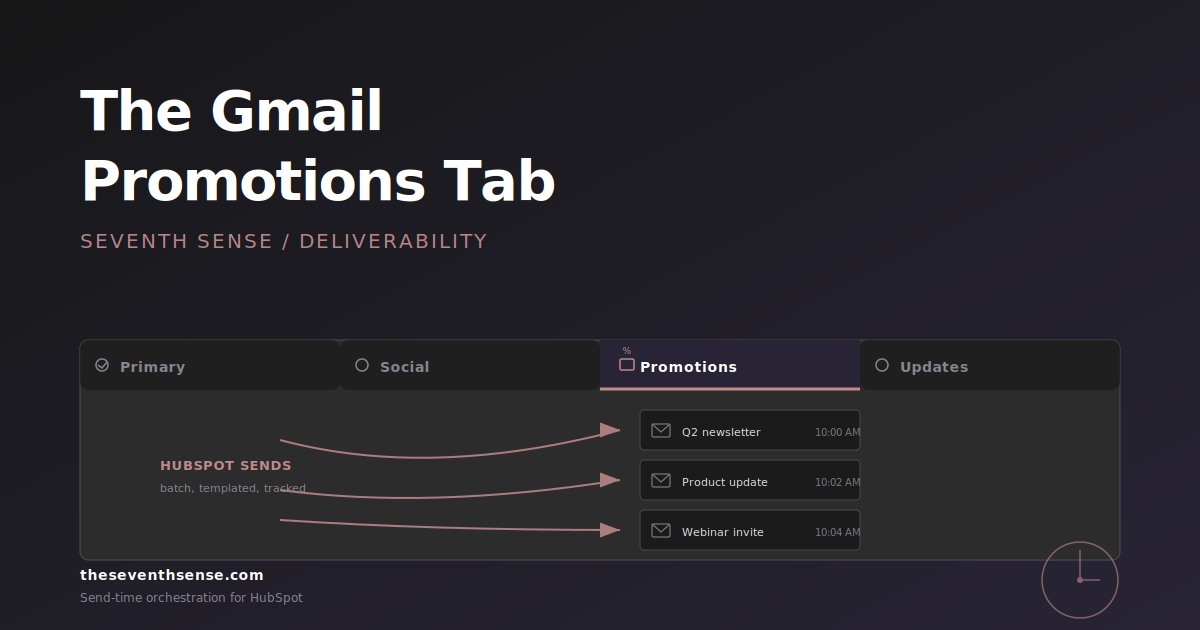
Inbox placement is the percentage of delivered messages that land in the primary inbox — not spam, not the Gmail Promotions tab, not a quarantined folder, and not any of the filters most enterprise Exchange admins have configured silently in the background.
Inbox placement is the metric that actually determines whether your email gets read. A message in spam has roughly a 1% chance of being opened. A message in the Gmail Promotions tab is somewhere around 15%. A message in the primary inbox is 25-45% for most B2B senders. The difference between 99% delivery with 60% inbox placement and 99% delivery with 92% inbox placement is the difference between a campaign that works and one that doesn't — and HubSpot's standard reporting will show those two campaigns as identical.
Why HubSpot only reports delivery
This isn't a HubSpot conspiracy. It's a technical constraint. Once an email is accepted by the receiving server, HubSpot has no visibility into what happens next. The receiving server doesn't send a callback that says "by the way, we filed that to spam." Mailbox providers consider their filtering decisions proprietary, and they don't share them with senders — the closest you can get is aggregate sender-side data through Google Postmaster Tools or Microsoft's SNDS, neither of which tells you per-message placement.
So HubSpot reports the data it has, which is delivery. The data it doesn't have — placement — is the data you actually need. The gap between those two numbers is where every deliverability problem hides.
How to actually measure inbox placement
Because mailbox providers don't tell you where the email landed, you have to infer it from signals. There are three real methods:
1. Seed list testing
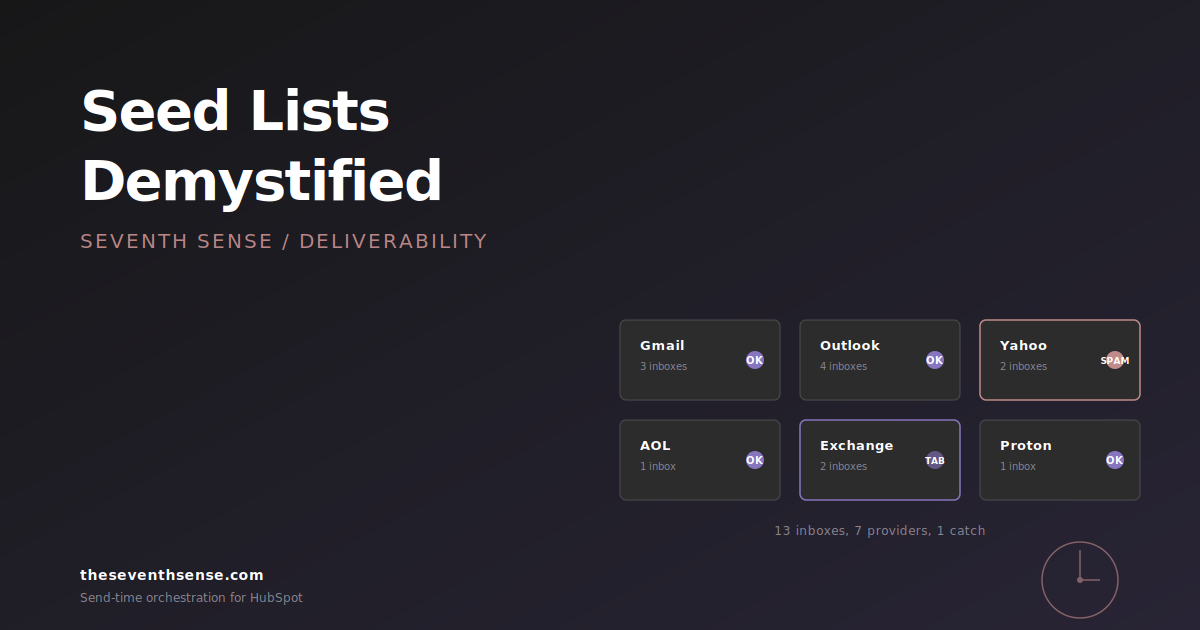
You maintain a list of test accounts across major mailbox providers (Gmail, Outlook, Yahoo, AOL, corporate Exchange) and send your campaigns to them in parallel with the live send. After the send, you check each seed account to see whether the message landed in inbox, promotions, or spam. The percentage that hit the inbox is your placement estimate. The seed list testing guide covers the setup in detail.
This works, but it's a sample, not a measurement. Mailbox providers personalize filtering decisions based on the recipient's engagement history. Your seed account at Gmail is not the same as your customer's Gmail account, and the placement could differ.
2. Engagement-based inference
If you know the typical open rate for a campaign type and audience — say, a customer newsletter that historically opens at 28% — and a specific send drops to 14% with the same content and audience, something happened to placement. The drop didn't happen because your subject line got worse. It happened because more of those messages landed somewhere other than the inbox.
This is a lagging indicator and it's noisy, but it's the most accessible signal for marketers who don't have seed lists. The combination of stable subject-line performance and a sudden engagement drop is almost always a placement event.
3. Provider-specific reporting
This is the method most marketers don't know exists. By breaking your delivery and engagement metrics out by mailbox provider, you can spot placement problems at the provider level before they appear in your overall numbers. If your Gmail open rate suddenly drops 12 points while Outlook stays flat, that's not a content problem. That's a Gmail placement problem.
HubSpot doesn't surface this breakdown natively. You have to either build it from raw event data or use a deliverability tool that exposes it. We built provider-specific reporting into our Delivery Insights module precisely because the question "what's my Gmail placement?" is impossible to answer with HubSpot's default reports.
The principle most marketers miss
Here's the principle: delivery is a binary that HubSpot can see. Placement is a spectrum that only the recipient can see. Treating delivery as a quality metric is like treating a package being signed for at a warehouse as a delivery to the customer. The signature happened. The customer still doesn't have their thing.
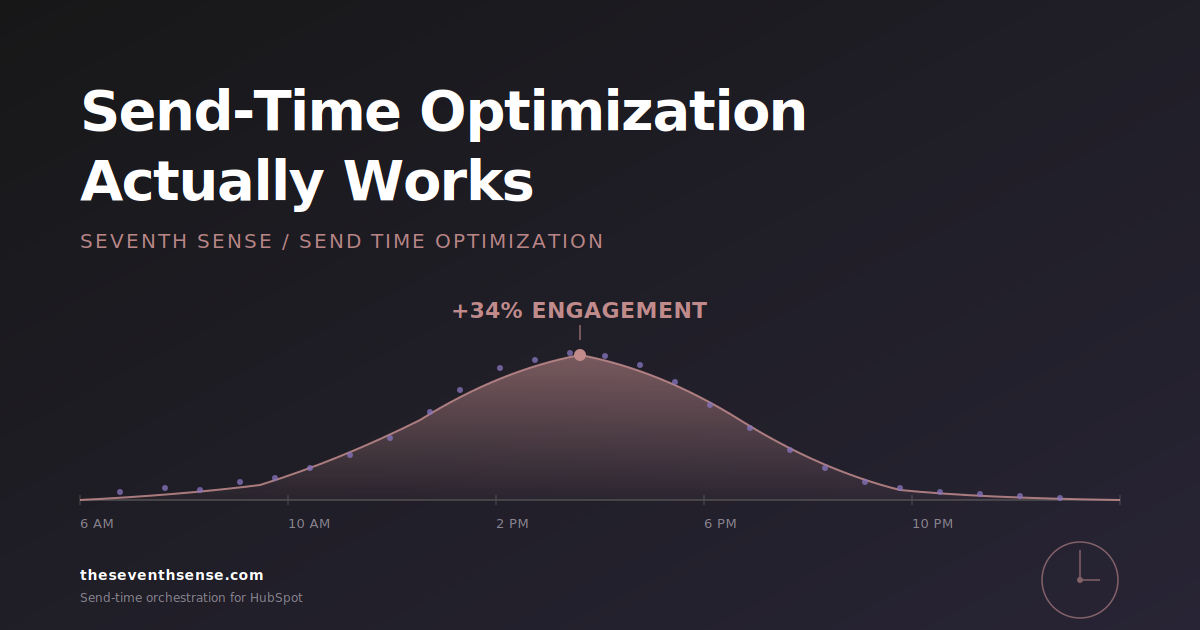
The corollary: if your boss asks you to optimize for delivery rate, the answer is "delivery rate is already 98% and that's not the problem we have." If you optimize for delivery rate, you optimize for being accepted by mail servers, which you already are. The thing worth optimizing for is placement, which lives in entirely different signals: authentication, engagement history, sender reputation, content patterns, and send-time consistency.
Where Seventh Sense fits in
Seventh Sense doesn't replace HubSpot's reporting. It adds the placement-side data HubSpot doesn't have. The Delivery Insights feature we originally shipped for Marketo in November 2025 surfaces inbox-provider-specific performance — the data that tells you whether your Gmail customers are getting your emails the same way your Outlook customers are. The same principle is what powers our HubSpot deliverability work: we treat delivery as a starting point, not a finish line.
The related metric to watch is engagement latency. The Email Latency Metrics we shipped in October 2025 measure how quickly recipients open after a send, and that timing signal often surfaces placement problems before raw open rates do. If your usual open latency is 18 minutes and it suddenly jumps to 4 hours, those emails aren't landing where they used to.
Frequently asked questions about email inbox placement
Is HubSpot's 98% delivery rate actually good?
It's a baseline, not a quality signal. Modern ESPs reliably deliver to mail servers; the threshold for "good" delivery is 95% or higher across virtually any well-configured account. The interesting question is what happens after the server accepts the mail. A 98% delivery rate with 60% inbox placement is a deliverability disaster wearing a green checkmark.
How do I find out what my actual inbox placement is?
Three options, in increasing order of accuracy: compare engagement trends over time to spot placement drops, set up a seed list across major providers and inspect placement manually, or use a tool that breaks engagement out by mailbox provider so you can spot placement events at the provider level.
Does HubSpot plan to add inbox placement reporting?
Not in any roadmap I'm aware of. The data isn't available through standard SMTP feedback, so any vendor offering placement metrics is doing it through seed-list inference or provider-specific engagement analysis. HubSpot's reporting focuses on the events it can directly observe.
Why does inbox placement vary so much by mailbox provider?
Each major provider has independent filtering logic. Gmail weights engagement heavily, Outlook weights authentication and sender history, Yahoo weights complaint rate, corporate Exchange weights whatever the admin configured. The same campaign can hit 94% placement at Gmail and 70% at Outlook because they're asking different questions.
Where to go from here
The first thing to do is stop treating HubSpot's delivery rate as a deliverability metric. It's a transit metric, and once you internalize that, you'll see most of your campaign reporting differently.
The second thing is to get a placement signal you can actually act on. The free trial of Seventh Sense connects to HubSpot in about 15 minutes and starts surfacing provider-specific engagement immediately. You'll see within a week which providers are filtering you and which aren't — the breakdown HubSpot's native reports can't give you.
Delivery without placement is a vanity number. Find out what's actually landing.
See what your email program could be doing.
Connect Seventh Sense to your HubSpot portal and watch the AI surface per-person engagement profiles, per-inbox-provider performance, and AI-driven optimization recommendations - within 24 hours.
Try it free →